Pricing is an important strategic issue because it is related to product positioning and affects other marketing mix elements such as product features, distribution decisions and promotion. Section 13 has several tools and strategy suggestions to help decide on product prices. In setting prices, companies must take into account their own costs as well as the fees charged by the various players in the supply chain. There is a demonstration and sample calculations to show the relationships among price, markups and margins at the processor level and at the retailer / foodservice distributor level.
The Food & Beverage Processing in Manitoba Reference Manual (Third Edition, 2017) provides a more detailed discussion on approaches to using pricing strategies to achieve sales and marketing objectives. Analytical techniques to tie pricing strategies to profitability are provided as well. There is a detailed presentation with examples of the trade terms, deals and allowances that retailers and distributors expect from food and beverage suppliers. The implications of these cost factors are discussed and their impact on prices, margins and markups is explained.
PRICING STRATEGIES
Penetration Pricing
A low price to stimulate demand, used when:
- Lower prices result in overall increased growth in the market volume or increased demand for the company's product
- The company sells higher margin complementary products that are being pulled along with the sale of lower priced products (e.g. “loss leaders”)
- The company enjoys economies of scale
- Competitors have high cost structures
Parity Pricing
Setting the price near or at competitive levels and using other marketing variables to implement strategies, used when:
- Total market volume will not grow with lower prices
- Competitors can easily match any price decrease
Premium Pricing
Setting a price above competitive levels, used when:
- A company can differentiate a product in terms of higher quality or special features
- A company has little excess capacity and where it is difficult for competitors to enter the industry
MONITORING COSTS
A multi-product company needs to track costs for each product in order to tell which products are doing well and which need additional marketing support.
To gather all the relevant information, a company needs to track two types of costs:
- Variable costs (direct costs of manufacturing): costs specific to the manufacturing of a particular product (i.e. labour, raw materials, and supplies)
- Fixed costs: ongoing costs that occur whether a business is shut down for a period of time or in full production (i.e. depreciation, insurance, taxes, selling and administration costs, utilities, and other costs)
Fixed costs can be broken down into two kinds of costs. Traceable fixed costs are those that can be related to a product line on a non-arbitrary basis. Non-traceable fixed costs are incurred on behalf of the business as a whole and cannot be assigned to a specific product line.
Contribution Analysis
A multi-product company needs to track costs for each product in order to tell which products are doing well and which need additional marketing support.
To gather all the relevant information, a company needs to track two types of costs:
- Variable costs (direct costs of manufacturing): costs specific to the manufacturing of a particular product (i.e. labour, raw materials, and supplies)
- Fixed costs: ongoing costs that occur whether a business is shut down for a period of time or in full production (i.e. depreciation, insurance, taxes, selling and administration costs, utilities, and other costs)
Fixed costs can be broken down into two kinds of costs. Traceable fixed costs are those that can be related to a product line on a non-arbitrary basis. Non-traceable fixed costs are incurred on behalf of the business as a whole and cannot be assigned to a specific product line.
| Company Total | Product One | Product Two | Product Three | Product Four | |
| Sales | $1,120 | $300 | $450 | $220 | $150 |
| Variable costs of goods sold | 205 | 50 | 70 | 40 | 45 |
| Gross profit margin | $915 | $250 | $380 | $180 | $105 |
| Other variable costs | 30 | 0 | 20 | 10 | 0 |
| Variable contribution margin | $885 | $250 | $360 | $170 | $105 |
| Traceable fixed costs: | |||||
| Sales salaries | 280 | 70 | 95 | 65 | 50 |
| Manufacturing salaries | 180 | 50 | 70 | 40 | 20 |
| Packaging salaries | 105 | 30 | 25 | 20 | 30 |
| Advertising of specific product lines | 115 | 30 | 50 | 20 | 15 |
| Rent and utilities | 70 | 20 | 30 | 15 | 5 |
| Total | $750 | $200 | $270 | $160 | $120 |
| Total contribution | $135 | $50 | $90 | $10 | ($15) |
| Non-traceable fixed costs: | |||||
| Company advertising | $40 | ||||
| General and administrative overhead | 60 | ||||
| Total | $100 | ||||
| Net operating profit | $35 | ||||
Salaries can be split according to hours spent on a product or some other reasonable basis. Rent and utilities can be split based on volume allocations.
Company advertising and general and administrative overhead cannot be allocated to specific products.
Which products should receive additional support becomes clearer after we calculate the percentage variable contribution margin (PVCM).
![]()
PVCM shows which products contribute the greatest amount to overhead and profit for each additional dollar spent to increase sales.
From the above example:
| Company Total | Product One | Product Two | Product Three | Product Four | |
| PVCM | 0.79 | 0.83 | 0.80 | 0.77 | 0.70 |
SETTING PRICES
Two tools that are important for setting prices are:
- Break-even analysis
- Cost-volume relationships
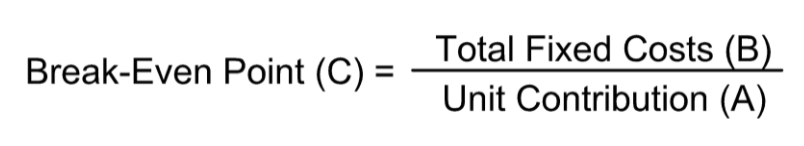
Break-even Analysis
Break-even analysis can be used as a tool for initially setting a product's price or for calculating the effects of a price change.
The break-even point is where total revenue (price times volume in units) equals total cost. Below the break-even volume of units sold, losses are incurred. Above break-even volumes, profits are realized.
Sunk costs such as research and development used to develop a product should be ignored. Depreciation per unit should be used as a cost rather than the full cost of a piece of equipment.
| Unit Selling Price | $21.95 | $23.95 | $25.95 | $27.95 | $29.95 |
| Unit Variable Cost | $7.95 | $7.95 | $7.95 | $7.95 | $7.95 |
| Unit Contribution (A) | $14.00 | $16.00 | $18.00 | $20.00 | $22.00 |
| Estimated Sales | 27,500 | 27,000 | 25,000 | 20,000 | 18,000 |
| Revenue | $603,625 | $646,650 | $648,750 | $559,000 | $539,100 |
| Fixed Costs (B) | $400,000 | $400,000 | $400,000 | $400,000 | $400,000 |
| Variable Costs | $218,625 | $214,650 | $198,750 | $159,000 | $143,100 |
| Profit (loss) | ($15,000) | $32,000 | $50,000 | $0 | ($4,000) |
| Break-even (units) (C) | 28,571 | 25,000 | 22,222 | 20,000 | 18,182 |
Cost-Volume-Profit Relationships
Product 1
| 2,000 units | 4,000 units | |
| Unit Variable Cost | $40 | $40 |
| Total Variable Cost | 80,000 | 160,000 |
| Total Traceable Fixed Costs | 240,000 | 240,000 |
| Total Direct Cost | 320,000 | 400,000 |
| Divided by Volume | 4000 | 8000 |
| Average Unit Cost | $80/unit | $50/unit |
CALCULATING MARKUPS AND MARGINS
Companies must take into account their own costs as well as the markups required to cover costs of promotion, discounts and many other allowances, as a product moves toward the consumer when setting prices. In the food business, the terms mark-up and margin are both used. They mean different things. The food processor must understand the differences and the relationship between the two terms when setting their wholesale prices. A mistake in the use of these terms can lead to price setting that is substantially too high or low, resulting in lost sales or lost profits, respectively.
Margin (also known as gross margin) is selling price (or wholesale price), minus the cost of goods sold (manufacturing cost). For example, if a product sells for $10 and costs $7 to manufacture, its margin is $3. Or, stated as a percentage, the margin percentage is 30% (calculated as the margin divided by selling price times 100%).
Markup is the amount by which the cost of a product is increased in order to calculate its selling price. To continue with the example above, a markup of $3 from the $7 cost yields the $10 price. Or, stated as a percentage, the markup percentage is 43% (calculated as the markup amount divided by the product cost times 100%).
To derive other markup percentages, the calculation is:
Markup = Margin divided by (1 – margin)
For example, if the retailer or foodservice distributor uses a 30% margin,
Markup = 30% / (1 – 30%)
= .3 / .7
= 43%
When the markup is known, to calculate the margin:
Margin = Markup divided by (1 + markup)
Using a 43% markup,
Margin = 43% / (1 + 43%)
= .43 / 1.43
= 30%
As a rule of thumb, retailers' margins average around 30% with distributors’ margins being as high as 30% depending on what services are being provided. From the discussion above, this equates to a retail markup of 43%. Keep in mind that we are now working from the product’s wholesale price and adding a retailer / distributor markup to determine the retail selling price.
Continuing with our original product example with a $7 cost to manufacture and a $10 wholesale price that provides a gross margin of 30% (or 43% markup) to the processor:
Wholesale price = Manufacturing cost + Processor markup
= $7.00 + 43%
= $7.00 + $3.00
= $10.00
Retail price = Wholesale price + Retail / Distributor markup
= $10.00 + 43%
= $10.00 + $4.30
= $14.30
The selling price to the end consumer can easily be twice the manufacturing cost.
Trade Terms, Deals and Allowances
When a food or beverage processor sells to a retail chain or foodservice distributor, various costs, discounts and trade allowances must be negotiated and added to the manufacturing cost as a markup to calculate the wholesale price. These discounts and trade allowances include listing fees, volume purchase allowances (discounts), allowances for damaged goods, promotion, co-op advertising, warehousing and freight charges and several other cost factors.
Depending on the terms negotiated with a specific retail or foodservice distributor, the net result of discounts and trade allowances could be a 30% to 45% total rebate off invoice. This must be understood when wholesale and retail prices are being calculated. For example, using a $10 manufacturing cost, in order to cover this range of rebates, the wholesale price range is:
Wholesale price = Manufacturing cost + Processor markup of 30% to 45% = $13.00 to $14.50
Now, using retailer markups ranging from 35% to 50%, creates a retail price range of:
Retail price = Wholesale price + Retailer markup of 35% to 50% = $17.55 to $21.75
If instead of markup, a margin was being calculated, it would be based on the price after markup was added, compared to the price without markup. Margin calculations for the wholesale level of above example shows:
- Wholesale (processor) margin = Wholesale price less Manufacturing cost divided by Wholesale price
= ($13.00 - $10) / $13.00 = 23.1% compared to a markup of 30%
= ($14.50 - $10) / $14.50 = 31.0% compared to a markup of 45%
When negotiating and setting prices, the food processor must be clear on the differences between margins and markups, and remember there are two different markups added to the manufacturing cost to calculate the retail price.